
除了 早期测序质控,比对后质控,还有一个质控——实验质控(带生物学意义的质控)
deeptools真的很deep
work_dir=/home4/sjshen/project/m6a/GSE29714_Cell
hisat2_bam_dir=$work_dir/1.1_hisat2/mouse/position_sorted_bam

echo $hisat2_bam_dir
cd $hisat2_bam_dir

(nohup multiBamSummary bins  -p 60 --bamfiles $hisat2_bam_dir/*bam -out ./deeptools/results_whole_region.npz ) &
(nohup multiBamSummary BED-file --BED ./mm10.RefSeq.bed  -p 60 --bamfiles $hisat2_bam_dir/*bam -out ./deeptools_qc/results_gene_region.npz ) &
Tips1:multiBamSummary是deeptools套件的一个函数,主要用于生成下游质控的初始文件
Tips2:默认划bins是10kb一个bin
Tips3:mm10.RefSeq.bed 来自 UCSC TABLE broswer
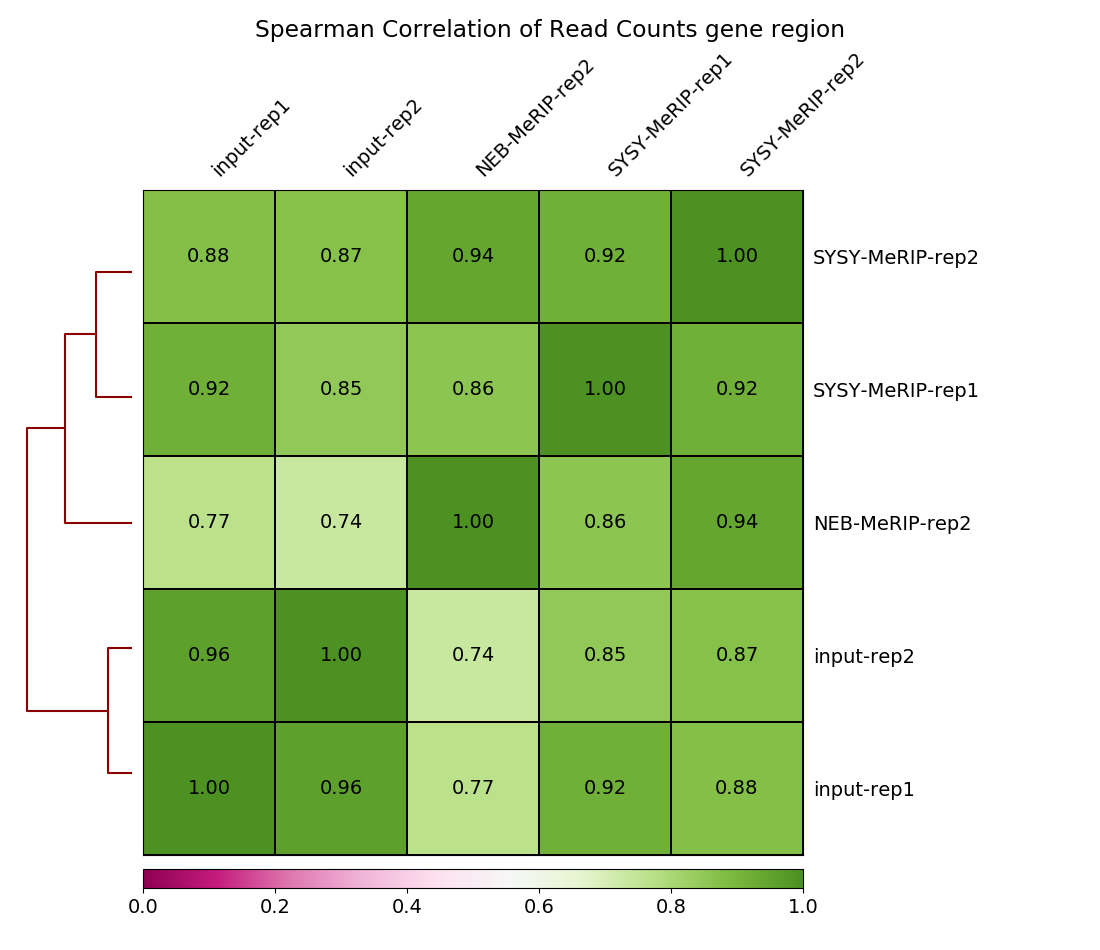
plotCorrelation -in results_gene_region.npz --corMethod spearman --skipZeros --plotTitle "Spearman Correlation of Read Counts gene region" \
--labels SYSY-MeRIP-rep1 input-rep1 NEB-MeRIP-rep2 SYSY-MeRIP-rep2 input-rep2 --colorMap PiYG \
--whatToPlot heatmap --plotNumbers -o heatmap_SpearmanCorr_readCounts_gene_region.png --outFileCorMatrix SpearmanCorr_readCounts_gene_region.tab &
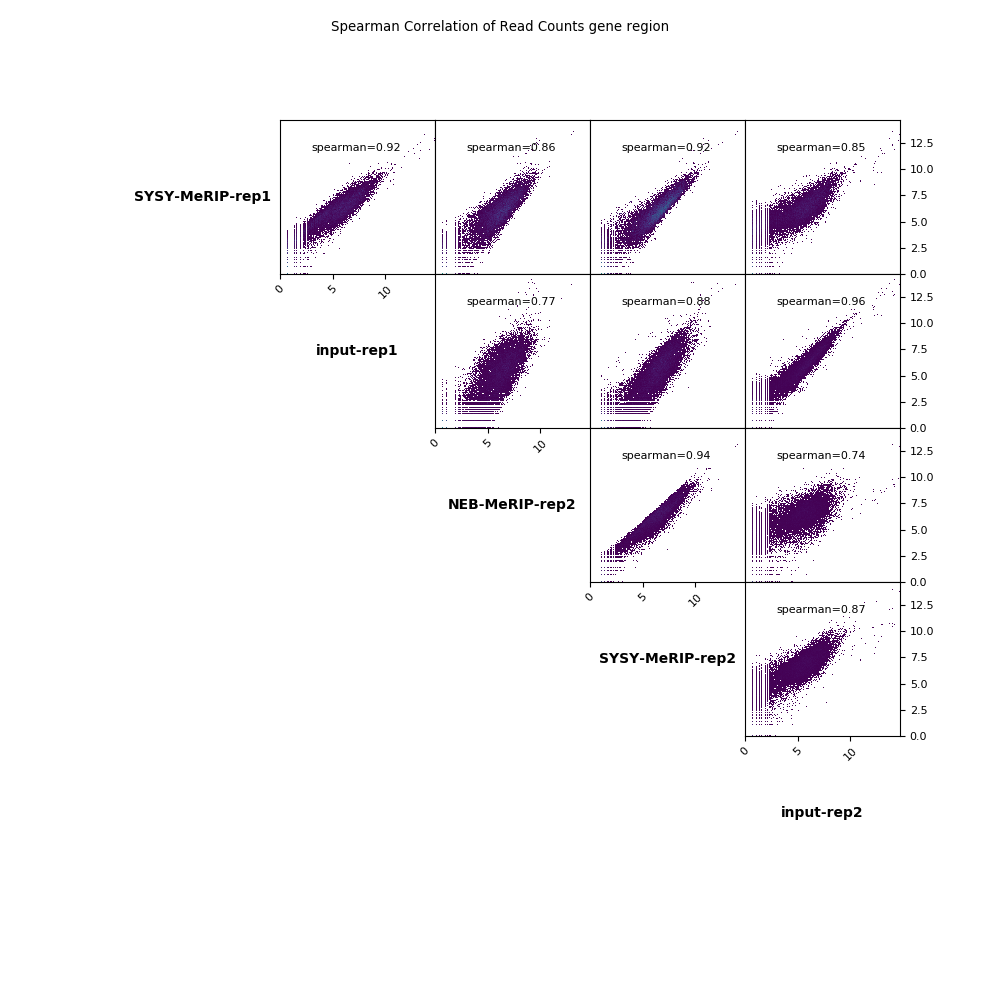
plotCorrelation -in results_gene_region.npz --corMethod spearman --skipZeros --plotTitle "Spearman Correlation of Read Counts gene region" \
--labels SYSY-MeRIP-rep1 input-rep1 NEB-MeRIP-rep2 SYSY-MeRIP-rep2 input-rep2 --log1p \
--whatToPlot scatterplot -o heatmap_SpearmanCorr_readCounts_gene_region_2.png &
Tips1:spearman 和 pearson 是最常用的方法,pearson更容易受异常值影响
Tips2:用于判断异常样本
Tips3:文件名太长可以用 --labels 修改
Tips4:可修改颜色
heatmap
scatterplot
cd  $hisat2_bam_dir/deeptools_qc

plotPCA --transpose --markers 'o' '>' 'o' 'o' '>' -in results_gene_region.npz -o PCA_readCounts_gene_region.png -T "PCA of read counts gene region" --outFileNameData PCA_readCounts_data_gene_region.tab &

plotPCA --transpose --markers 'o' '>' 'o' 'o' '>' -in results_whole_region.npz -o PCA_readCounts_whole_region.png -T "PCA of read counts whole region" --outFileNameData PCA_readCounts_data_whole_region.tab &
Tips1:PCA是一种降维方法,他将样本的诸多差异(基因|bins|...)浓缩到二维,其中PC1和PC2是区别最大的前两个维度
Tips2:默认取前1000个影响因素
Tips3:用于判断异常样本
Tips4:文件名太长可以用 --labels 修改
gene_region范围计算

whole_region范围计算

work_dir=/home4/sjshen/project/m6a/GSE29714_Cell
hisat2_bam_dir=$work_dir/1.1_hisat2/mouse/position_sorted_bam
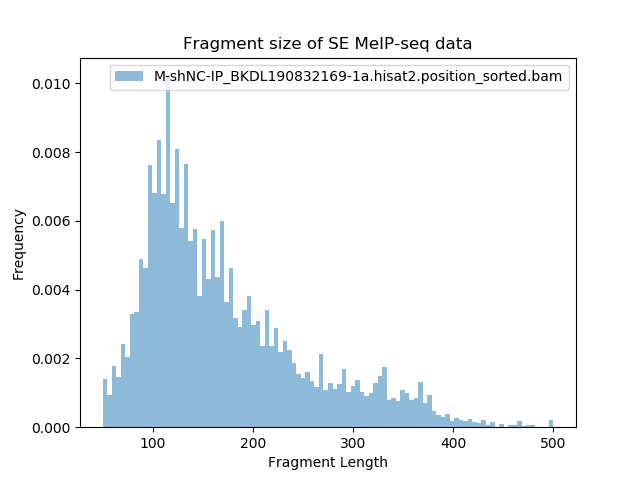
for i in $hisat2_bam_dir/*.bam
do
echo $i
(nohup bamPEFragmentSize -p 20 -hist ${i##*/}fragmentSize.png -T "Fragment size of SE MeIP-seq data" --maxFragmentLength 200 --bamfiles $i --samplesLabel ${i##*/}) > ./${i##*/}fragmentSize.log &
done
Tips:主要用于判断片段超声情况,一般m6A大约在100-200nt
plotFingerprint
plotCoverage
#这两个函数主要检查抗体富集和reads覆盖度,仅供参考
## 1.input normalize ##  消除背景噪音

ChIP=C57BL6_Brain_Sample_1_MeRIP-SYSY.hisat2
Input=C57BL6_Brain_Sample_1_Non-IP_Control.hisat2
operation=log2

bigwigCompare -p 50  -b1 ${ChIP}.bw  -b2 ${Input}.bw \
--operation ${operation}  --binSize 10 --pseudocount 1 \
-o ${ChIP}_${operation}_${Input}.bw --outFileFormat bigwig \
> ${ChIP}_${operation}_${Input}.log &

#--------------------------------------------------------------------

## 2.prepare matrix ##

cd /home4/sjshen/project/m6a/GSE29714_Cell/1.1_hisat2/mouse/position_sorted_bam/deeptools_profile/result

bw_dir1=/home4/sjshen/project/m6a/GSE29714_Cell/1.1_hisat2/mouse/position_sorted_bam/deeptools_bw/assemble_bw
region_dir1=/home4/sjshen/project/m6a/GSE29714_Cell/1.1_hisat2/mouse/position_sorted_bam/deeptools_profile/bed_home

bw_files="
$bw_dir1/C57BL6_Brain_Sample_1_MeRIP-SYSY.hisat2_log2ratio_C57BL6_Brain_Sample_1_Non-IP_Control.hisat2.bw
$bw_dir1/C57BL6_Brain_Sample_2_MeRIP-NEB.hisat2_log2ratio_C57BL6_Brain_Sample_2_Non-IP_Control.hisat2.bw
$bw_dir1/C57BL6_Brain_Sample_2_MeRIP-SYSY.hisat2_log2ratio_C57BL6_Brain_Sample_2_Non-IP_Control.hisat2.bw
"
region_files="
$region_dir1/mm10.RefSeq.cds.bed
"

try=MeIRP_profile_on_cds_mm10_input_norm

nohup computeMatrix scale-regions -p 100  -b 1000 -a 1000 --regionBodyLength 3000 -R $region_files \
-S $bw_files --startLabel cdsStart  --endLabel cdsEnd --binSize 50 \
--samplesLabel  SYSY-MeRIP-rep1 NEB-MeRIP-rep2 SYSY-MeRIP-rep2 \
-o ./${try}_computeMatrix.gz --outFileNameMatrix ./${try}_computeMatrix.matrix.tab \
--outFileSortedRegions ./${try}_computeMatrix.SortedRegions.bed > ./${try}_computeMatrix.log &

#--------------------------------------------------------------------

## 3.display graph  ##

try=MeIRP_profile_on_cds_mm10_input_norm

plotProfile --matrixFile ${try}_computeMatrix.gz --outFileName ${try}_profile_1.pdf --outFileNameData ${try}_profile_1.tab --dpi 720 --perGroup --numPlotsPerRow 2 --plotHeight 12 --plotWidth 16 &
plotProfile --matrixFile ${try}_computeMatrix.gz --outFileName ${try}_profile_2.pdf --outFileNameData ${try}_profile_2.tab --dpi 720            --numPlotsPerRow 2 --plotHeight 12 --plotWidth 16 &
Tips:主要查看基因CDS区域上带有m6a的reads的分布

# 也可以展示每个基因的情况
plotHeatmap --matrixFile ./${try}_computeMatrix.gz --outFileName ./${try}_peak.pdf --colorList "white,blue" --whatToShow "plot, heatmap and colorbar" --dpi 720 --missingDataColor white \
--refPointLabel "center" --regionsLabel " "  --xAxisLabel " " --sortRegions descend --sortUsing mean --heatmapHeight 30 --heatmapWidth 4 &
